When considering a geometric series in the form: \[ z_{n+1} = z_{n} + c \] Where \(z\) and \(c\) are complex numbers. One can ask if \(z_{inf}\) is stable for a given \(z_{0}\) and \(c\)
It is also mathimatically convienent that if the magnitude of \(z_{n}\) ever exceeds 2, we can be garunteed that the series will not converge.
Lastly, for computational simplicity, we make the assumption that if the magnitude does not exceed 2 in the first 200 ittterations, that it will converge. Let’s define that function:
Code
num_to_explode =function(z =complex(real =0, imaginary =0), c =complex(real =0, imaginary =0), max =200){ num =0while(num < max){if(Mod(z) >2){return(num) } z = z^2+ c num = num +1 }return(num)}num_to_explode =Vectorize(num_to_explode)
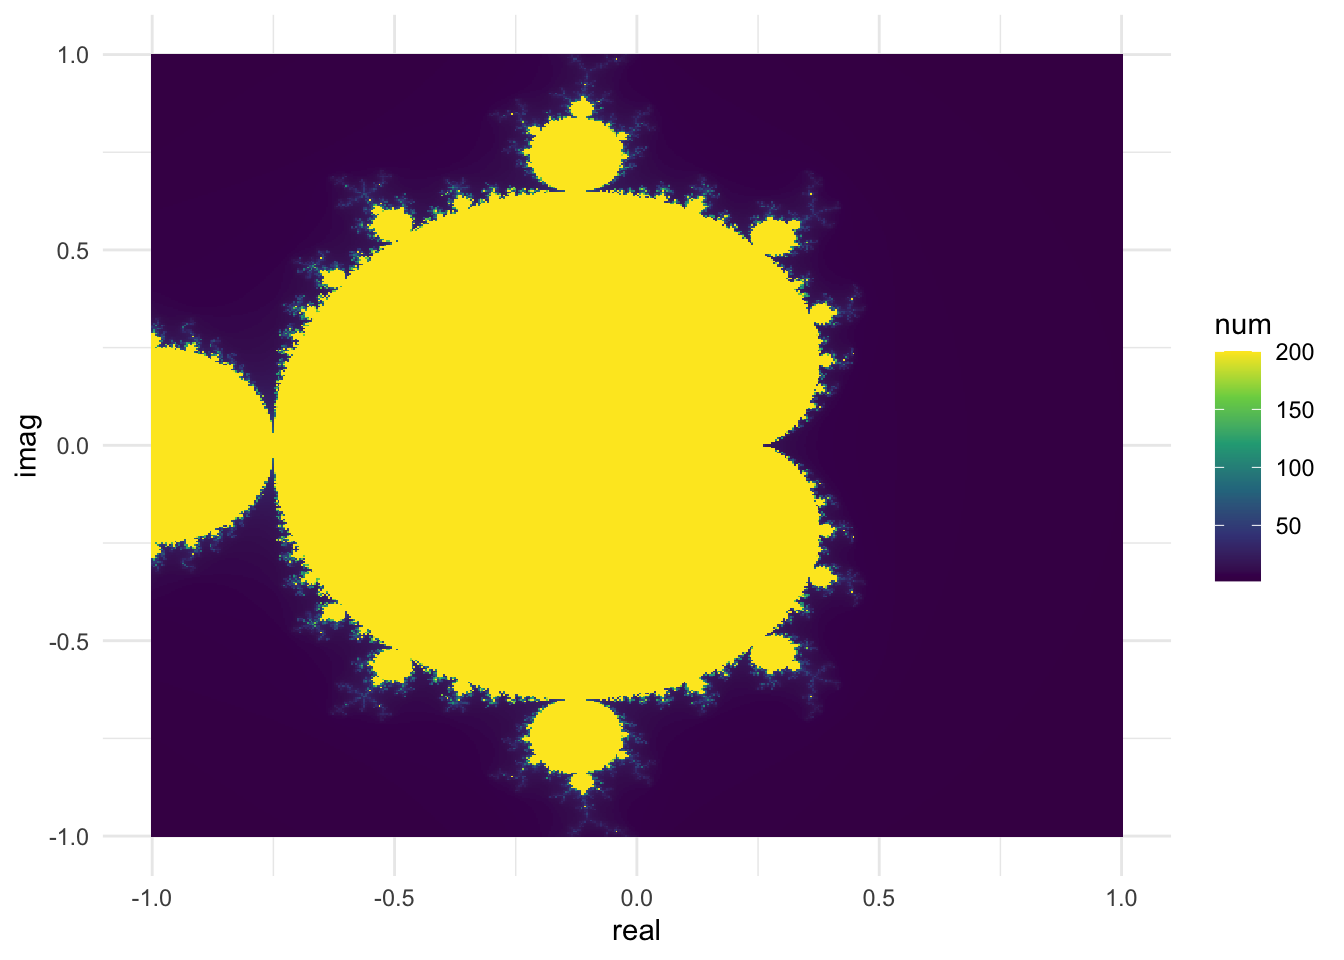
For the mandelbrot set, \(z_{0}\) is set to (0,0). Now we ask, for what values of \(c\) does the series converge? lets test that:
Now we will plot the number of itterations needed to explode, if the geometric series does not explode (converges), it will have the maximum number of itterations (in this case 200)
---title: "Plotting the Mandelbrot Set"author: "Kieran Mace"date: "2019-04-27"format: html: default---# Setup:When considering a geometric series in the form:$$ z_{n+1} = z_{n} + c $$Where $z$ and $c$ are complex numbers. One can ask if $z_{inf}$ is stable for a given $z_{0}$ and $c$It is also mathimatically convienent that if the magnitude of $z_{n}$ ever exceeds 2, we can be garunteed that the series will not converge. Lastly, for computational simplicity, we make the assumption that if the magnitude does not exceed 2 in the first 200 ittterations, that it will converge. Let's define that function:```{r}num_to_explode =function(z =complex(real =0, imaginary =0), c =complex(real =0, imaginary =0), max =200){ num =0while(num < max){if(Mod(z) >2){return(num) } z = z^2+ c num = num +1 }return(num)}num_to_explode =Vectorize(num_to_explode)```For the mandelbrot set, $z_{0}$ is set to (0,0). Now we ask, for what values of $c$ does the series converge? lets test that:```{r}library(dplyr)library(magrittr)library(ggplot2)real <-seq(-1, 1, length.out =500)imag <-seq(-1, 1, length.out =500)points_to_test =expand.grid(real = real, imag = imag)points_to_test %<>%mutate(z =complex(real =0, imaginary =0),c =complex(real = real, imaginary = imag),num =num_to_explode(z, c))```Now we will plot the number of itterations needed to explode, if the geometric series does not explode (converges), it will have the maximum number of itterations (in this case 200)```{r}ggplot(points_to_test,aes(x = real,y = imag,fill = num)) +geom_tile() +scale_fill_viridis_c() +theme_minimal()```